Launch is not a success. It is just the moment real behavior starts showing up.
If you do not track the right MVP success metrics, you end up making decisions based on vibes, loud feedback, or a few demo calls. That usually leads to the same pattern. Teams add features to fix uncertainty, scope grows, and the product still struggles because the core workflow never got stronger.
The fix is simple but disciplined. Define one activation moment, track your activation rate, and shorten the time-to-first value so users reach the payoff fast. From there, your product metrics should answer one question every week:
- Where are users dropping off?
- What single change will improve the next cycle?
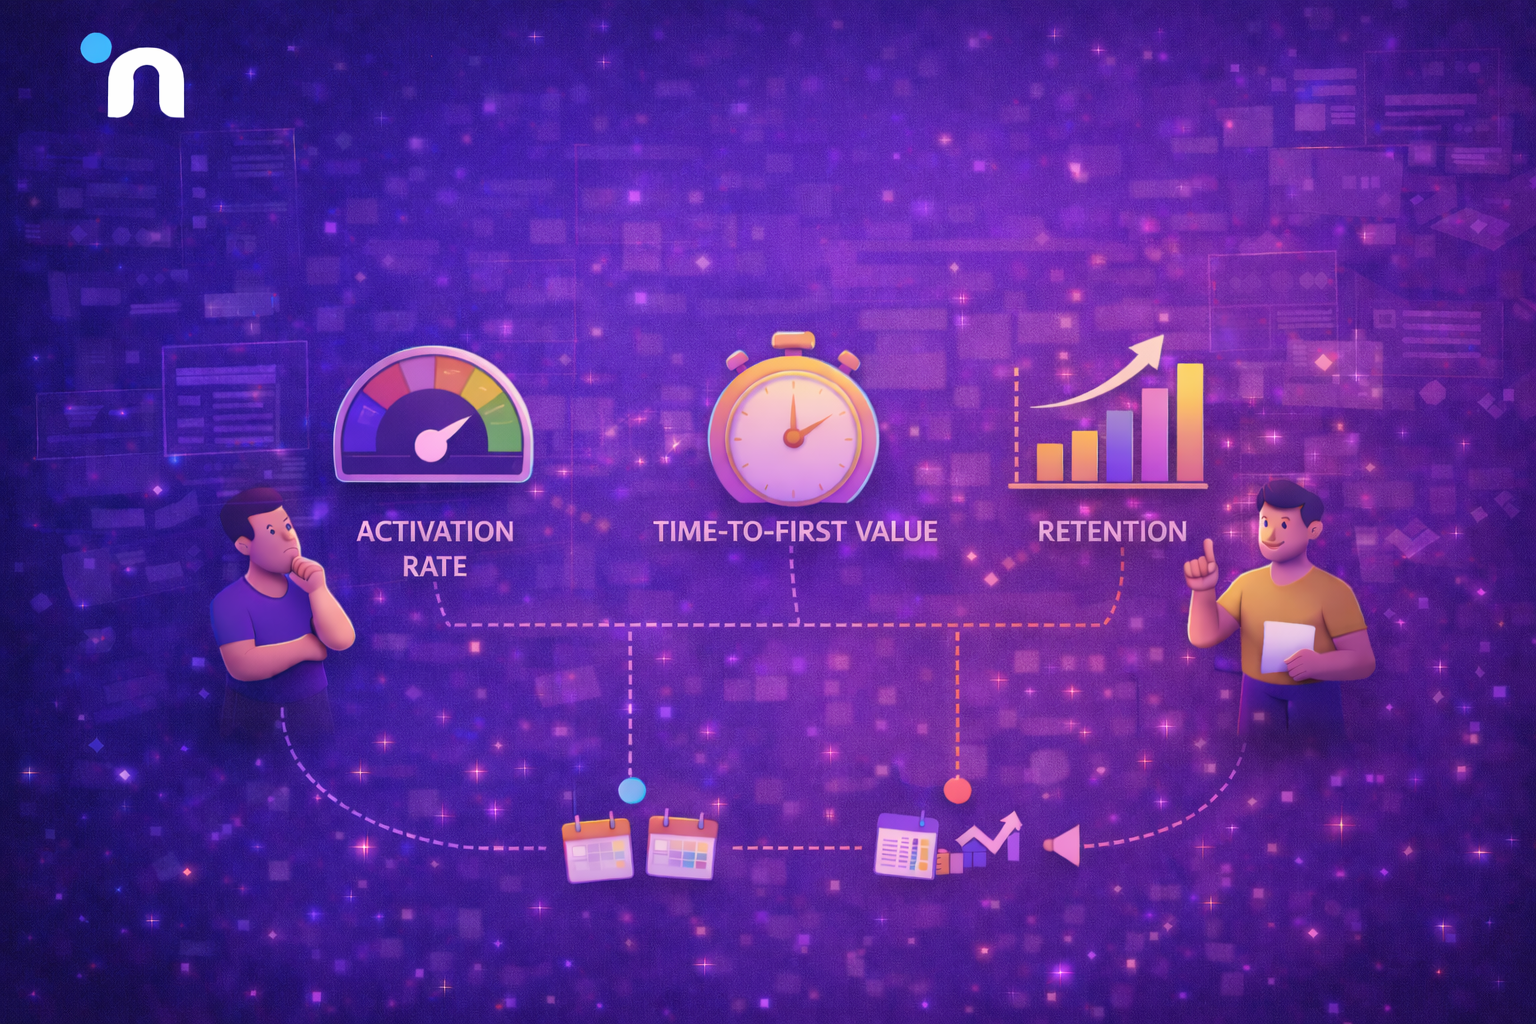
The most useful MVP success metrics are the ones that show real usage, not interest. Start with three only. Track activation rate, time-to-first value, and retention. If those are improving, you are building something people actually use. If they are flat, adding features will not fix the core problem.
What Success Means for An MVP
Success is not press, signups, or people saying they like the idea. Success is a user completing the core job without handholding, then coming back to do it again because it solved something real.
That is why MVP success metrics should be tied to one promise and one workflow. If you track everything, you learn nothing. If you track the few signals connected to what an MVP is built to prove, you can tell whether the product is pulling users forward or whether you are pushing it with demos, reminders, and manual effort.
A good definition of MVP success looks like this
- Users reach the activation moment consistently
- The time-to-first value is short enough that users feel the payoff quickly
- Repeat usage shows up without constant follow-up
The 5 MVP Metrics that Give A Clean Signal
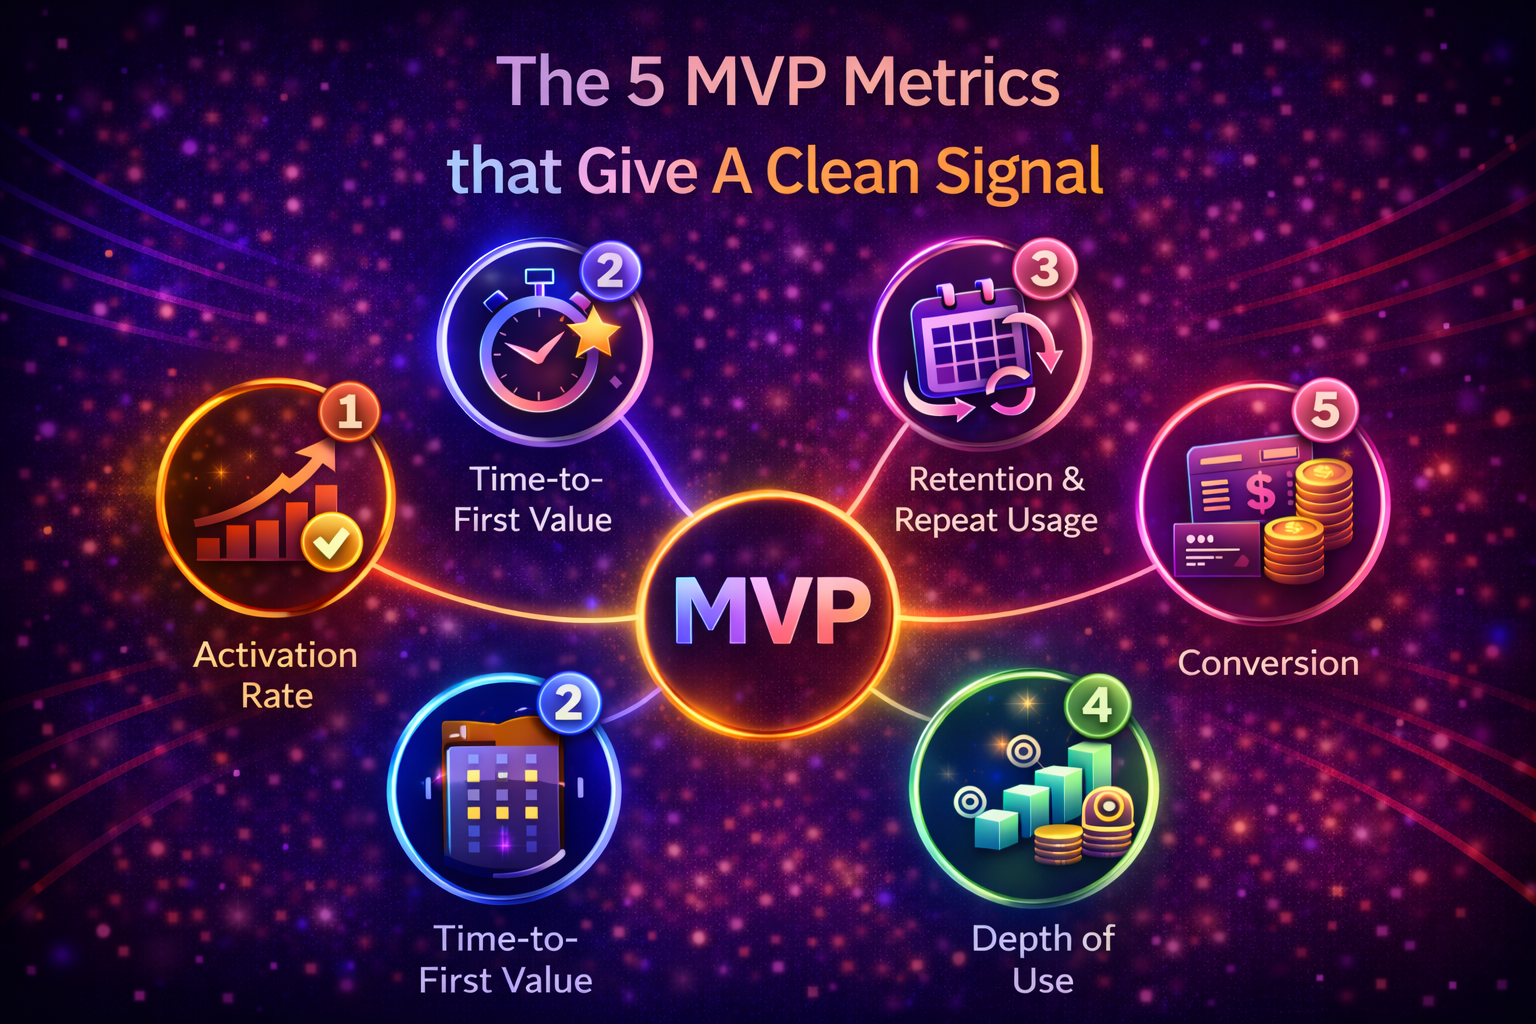
Most teams track too much too early. The goal is not a pretty dashboard. The goal is clarity on whether the core workflow is working and what to fix next. These metrics are useful because they connect directly to behavior and reduce guesswork.
1) Activation Rate
Your activation rate is the percentage of users who reach the first meaningful moment in the product. Define activation as one completed action that proves intent, not a login. For example, created the first project, added the first item, invited a teammate, or completed the first booking.
2) Time-to-First Value
Time-to-first value is how long it takes a new user to reach the first outcome they care about. Shortening it often beats adding features. Remove steps, reduce form fields, add better defaults, and guide users to the core action faster.
3) Retention and Repeat Usage
Retention answers one question.
Do users come back without being chased?
Early retention can be rough, but patterns matter. If users try once and disappear, the problem might be unclear, the workflow might be too hard, or the value is not strong enough.
4) Depth of Use
Depth of use shows how far users go beyond the first win. Pick 1 to 2 actions that indicate real adoption, not curiosity. For example, completed three tasks, processed five orders, created a second workflow, or invited a second teammate.
5) Conversion and Willingness to Pay
Conversion measures commitment, not interest. Track a paid pilot, a deposit, an upgrade, or a repeat behavior that correlates with payment. If you are not charging yet, measure the closest proxy that still has weight, like demo requests from the right audience or a clear usage threshold.
How to Track MVP Success Metrics Without Overcomplicating It
The goal is not to collect more data. The goal is to measure the few behaviors that tell you what to fix next.
These MVP success metrics work because each one maps to a clear decision.
- Are users reaching the first meaningful step?
- Are they getting value fast?
- Are they coming back?
If a metric does not change what you do next week, it is noise.
| Metric | What It Tells You | How to Measure | Common Mistake |
| Activation rate | Whether new users reach the first meaningful step | Users who complete the activation action ÷ total new users | Defining activation as signup or login |
| Time-to-first value | How fast users feel the first payoff | Median time from signup to first outcome | Measuring time-to-first session instead of first outcome |
| Retention | Whether users return without chasing | Percent returning in 7 or 14 days | Looking at one week only without trends |
| Depth of use | Whether users adopt beyond the first win | Count of key actions per user per week | Tracking too many actions and losing focus |
| Conversion | Whether users commit to pay or upgrade | Whether users commit to pay or upgrade | Counting demo calls or interest as payment intent |
A practical way to use these metrics is to turn each one into a weekly question.
If activation is low, the onboarding and first steps are too hard, or the promise is unclear.
If the time-to-first value is high, users are doing too much work before they see the payoff.
If retention is low, the value is not strong enough to pull them back, or the product does not fit into their routine.
Also, avoid changing five things at once. Pick the metric that is the weakest, make one focused change tied to the core workflow, then measure again. This creates a clean cause and effect. It is the fastest way to improve your MVP success metrics without guessing what worked.
Why Retention Matters More Than Hype
Early hype is loud, but it is not reliable. You can get signups from curiosity, a launch post, or a few demos, and still have a product people do not return to. Retention is different. It shows the workflow is valuable enough that users come back on their own, which is why it is one of the most honest MVP success metrics you can track.
Retention also changes the economics of what you build next. Bain has found that increasing customer retention rates by 5% can increase profits by 25% to 95%. When you improve retention, every improvement to onboarding, activation rate, and time-to-first value compounds instead of resetting every week with new users.
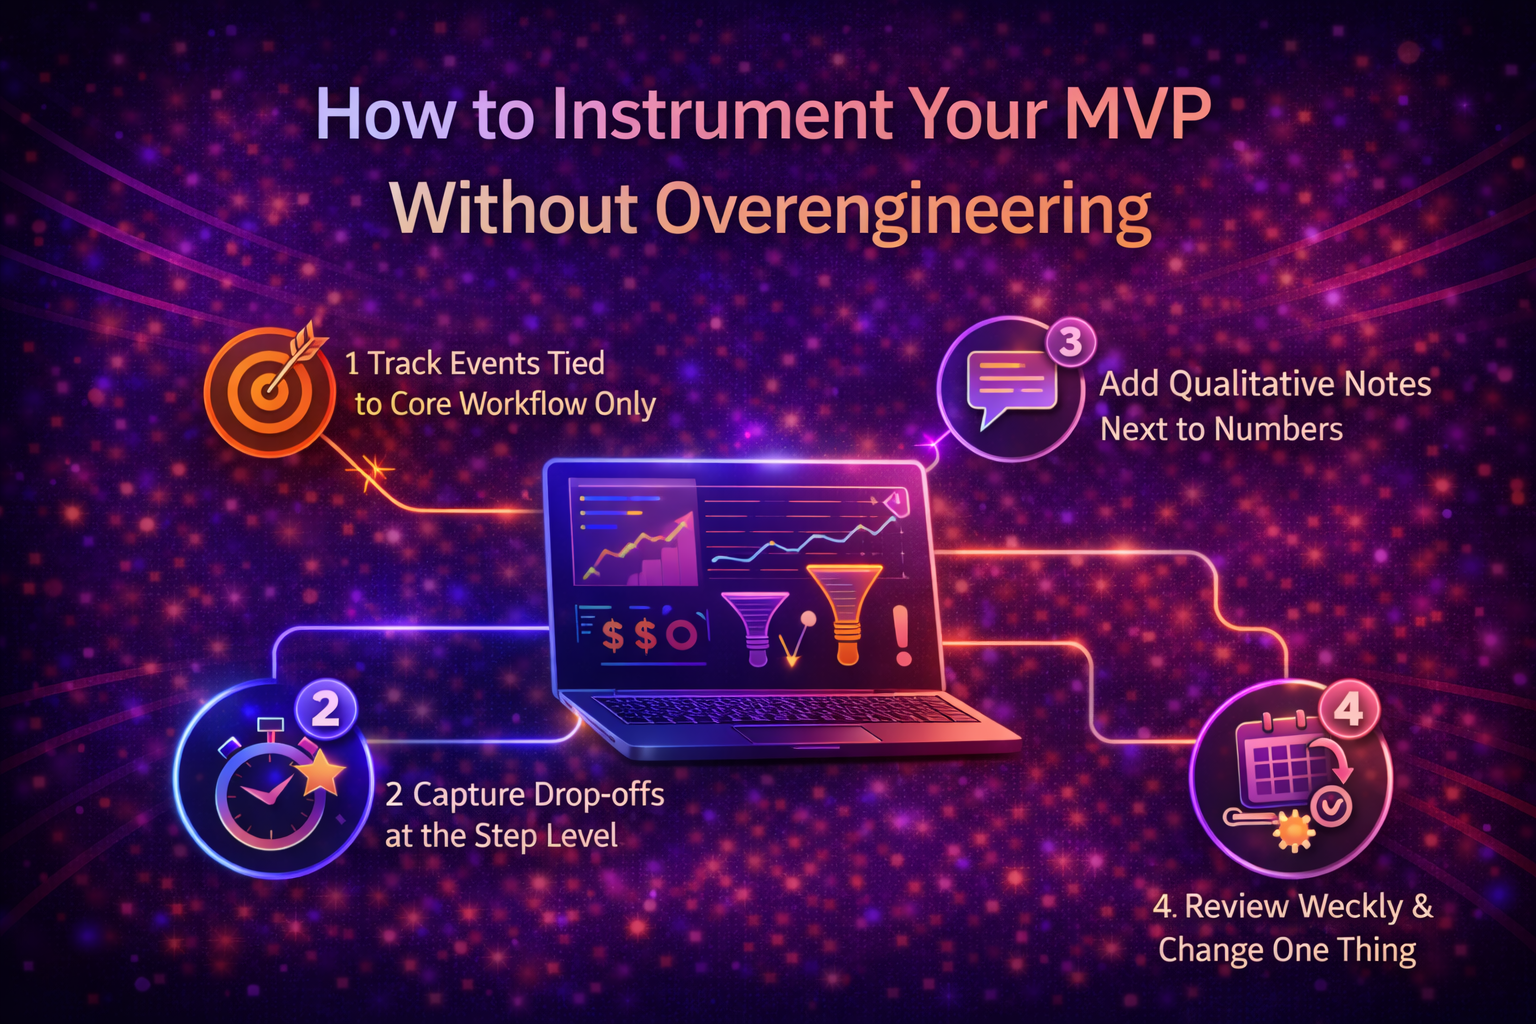
How to Instrument Your MVP Without Overengineering
Good tracking is not about more events. It is the right events. The goal is to capture product metrics that explain the core workflow, where users succeed, where they stall, and what happens right before churn.
Tracking should stay light in an MVP. You only need enough visibility to see where users move forward and where they stall, so you can improve the core flow without overbuilding analytics.
Here are the simplest tracking moves that keep your MVP metrics useful and actionable.
1) Track Events Tied to the Core Workflow Only
Instrument the few actions that represent progress. If you track everything, you will drown in the noise. Start with the steps that lead to activation, the first outcome, and repeat usage.
2) Capture Drop-offs at the Step Level
Do not just track that users failed. Track where they failed. If users abandon step two consistently, that is your highest leverage fix.
3) Add Qualitative Notes Next to the Numbers
Metrics tell you what happened. Short notes from user calls, support chats, or session recordings tell you why. That combination prevents guessing and helps you choose the right fix.
4) Review Weekly and Change One Thing at a Time
Metrics are only useful when they drive action. Review weekly, pick one bottleneck, make one change, and measure again. This is also how you protect scope, because decisions stay tied to evidence instead of opinions, and that supports setting a realistic build timeline before you commit.
How Metrics Connect to Cost and Scope Decisions
Metrics protect your budget by making priorities harder to argue with. Instead of debating features in meetings, you can tie every build decision to one measurable bottleneck and one expected outcome. That keeps scope disciplined because features have to earn their place.
A practical rule is to treat each change like a small bet. Pick one metric that is blocking progress, choose one change that should move it, and time box the work. If the metric moves, you keep going. If it does not, you stop and try a different lever. This approach prevents the common trap where teams keep adding “nice-to-have” features that feel productive but quietly inflate time and cost.
When you work this way, budgeting becomes a series of controlled experiments instead of a blank check. You invest in the fixes that create adoption, and you avoid paying for complexity that does not change outcomes, which is the whole point of budgeting without guessing.
Common Mistakes When Tracking MVP Metrics
The biggest tracking mistakes happen when metrics look busy but do not change decisions. If the numbers do not tell you what to fix next, you end up building based on opinions again, just with a dashboard open in another tab.
- Tracking too many product metrics early and losing the signal
- Defining activation rate as signup or login instead of the first meaningful step
- Measuring everything weekly, but changing five things at once
- Chasing vanity numbers like page views, impressions, or total signups
- Not separating new users from returning users, which hides real retention
- Ignoring context and skipping user conversations when a metric drops
- Defining success after launch instead of validating your MVP before you build
Conclusion
The goal of MVP success metrics is simple, and that is to replace guessing with evidence. When you track activation rate, time-to-first value, and retention, you can see whether the workflow is working and what to fix next without inflating scope.
Treat metrics like a weekly decision tool. Pick one bottleneck, make one focused improvement, then measure again. That rhythm keeps the product moving forward while protecting budget and timelines.
If you want an outside set of eyes on what to track and what to ignore, Novura can help you define the few product metrics that actually map to adoption and growth.
FAQs
Q1. What are the most important MVP success metrics?
The most important MVP success metrics are activation, time-to-first value, and retention. They tell you if users reach value and come back.
Q2. What is a good activation rate for an MVP?
It depends on the workflow and audience. A good starting point is a steady upward trend week over week, not a perfect number on day one.
Q3. How long should I measure an MVP before iterating?
Measure continuously, but iterate in weekly cycles. Change one thing, watch the impact, then repeat.
Q4. What if retention is low, but signups are high?
You have interest but not pull. Fix the core workflow, shorten time to value, and remove friction before adding new features.
Q5. Which product metrics are vanity metrics?
Page views, impressions, and total signups without activation or retention are usually vanity metrics. They do not prove adoption.